Shale I Stay or Shale I Go?
Lately, I’ve been thinking about crude oil.
A lot of very bright people are bearish on the short-term prospects for crude oil prices. Their argument is that the volume from the OPEC production cut (agreed upon in November) will be replaced by excess production from the excused OPEC members (Libya, Nigeria and Iran) and from the U.S. Furthermore, they would add, OPEC members historically haven't adhered well to quotas, so it won't add up to anything meaningful.
But let’s think about two things.
1. This whole market share approach ended badly in 2015 for everyone – including the U.S. What’s the other approach to market share? Margin. Back in December of 2015, in Vienna, Saudi Arabia tried without success to convince several OPEC members and the largest non-OPEC producer, Russia, to cut production. There was no agreement.
That was a little more than a year ago.
2. The former owner of one of the largest retail propane companies in Massachusetts once told me, “If I don’t have my tank set at a customer’s location, how much profit am I making on that tank? Zero. So I need to set that tank and then I can address the issue of how profitable that tank will be.” He was talking about gaining market share, then margin.
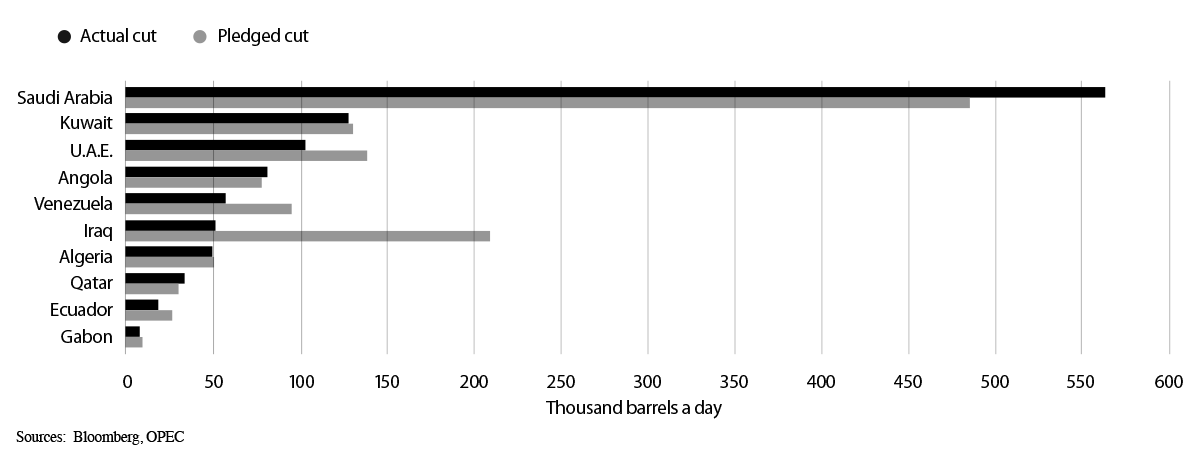
I don’t think 10 OPEC members, plus 11 non-OPEC countries, agreed to cut production by 1.8 million barrels per day and then largely held to pledged cuts (90% compliance) simply so that U.S. producers could be the long-term beneficiary.
OPEC member production cuts, actual (black) versus pledged (gray), are running at about 90% compliance.
Their short-term strategy, and the professed goal of their compliance, may be to reduce global crude inventories. But their end game is market share. And then more margin. They know that the U.S. can’t make up the shortfall in the next six months. They also know that the U.S. will try to make up the difference. So, in a way, I think the U.S. is being set up.
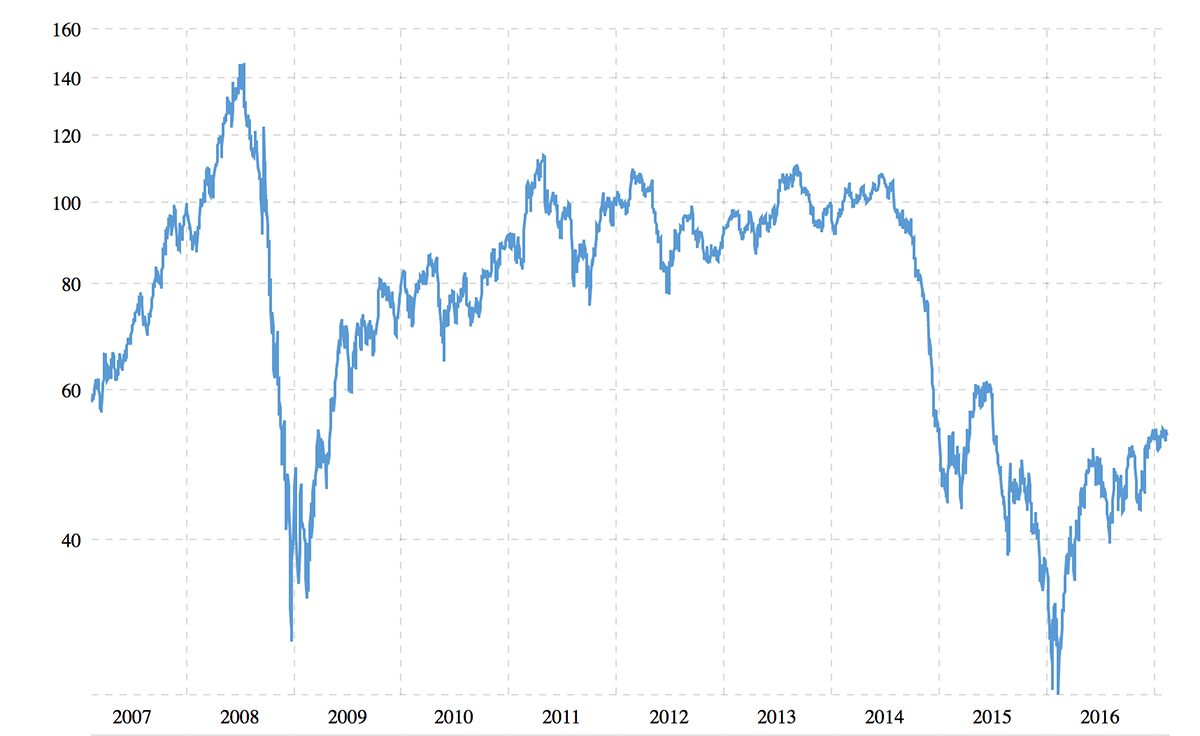
The chart below shows WTI crude oil prices per barrel going back 10 years.
Regarding direction for the price of propane, we mentioned two months ago that higher lows during the consolidation phase of a rising market often leads to a breakout in the trending direction.
Well, we may be seeing a similar pattern with crude oil. Note the recent consolidation, tightening ranges, and higher lows. Also, note the big gap above $60. (For reference, look back at last month’s blog and the propane chart with a similarly large price gap up). We’ve been stuck for several months in the $50 to $55 price range, but if crude oil prices push through resistance around $60.00 bbl, I would not be surprised by a breakout towards the $80 to $100 range.
Short term that will pull propane prices higher, but probably not for too long.
If crude oil does move sharply higher soon, for either a fundamental or geopolitical reason, we’re likely to see very large increases in U.S. crude production. Weekly production is already on a greatly accelerated track. In fact, we just saw the highest rig count in two years. So the next surge in crude oil prices could be followed by record-setting U.S. production of 10 million bbls./day (?) or more.
What happens then?
I think Saudi Arabia and Russia will largely adhere to production cuts for two or three months. They know that the U.S. can’t make up the difference and prices should rise if they show compliance. But if we see $80 to $100 bbl. before May, and the U.S. is producing at record production levels, OPEC (and non-OPEC members) will quietly ramp up production (in the interest of “price stability”), and it will be game on! We’ll see a shift from production cuts to another battle for market share resulting in the third major collapse in oil (and propane) prices since 2008, and likely pushing crude oil prices below the U.S. cost of production.
EIA Numbers for the Week (2/8/17):
- Propane inventories fell by 6.9 million barrels (55.8 mmbbls. new total)
Days of Propane Supply:
| 2/8/17 | 1/11/17 | 12/9/16 | 11/25/16 |
| 34 | 55 | 77 | 91 |
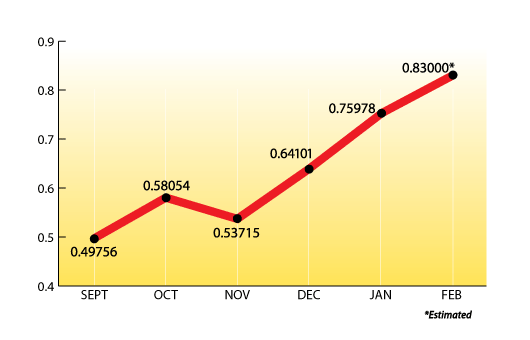
What’s Happening with Propane Prices?
Here are the Mt. Belvieu monthly averages for the past few months with a projection for February.
The Skinny:
Propane prices may not stay high for too much longer, but higher prices mean greater downside risk. Protect your margin by buying what you sell, and selling what you buy.
NOTE: We’ll be meeting over the next month with dozens of U.S. and Canadian producers as we start assembling our propane supply package for the May 2017 thru April 2018 contract period. Please be assured that we’ll work hard to come away with a competitively priced supply program to offer you soon.
NOTE: The views and opinions expressed herein are solely those of the author, unless attributed to a third-party source, and do not necessarily reflect the views of Ray Energy Corp, its affiliates, or its employees. The information set forth herein has been obtained or derived from sources believed by the author to be reliable. However, the author does not make any representation or warranty, express or implied, as to the information’s accuracy or completeness, nor does the author recommend that the attached information serve as the basis of any buying decision and it has been provided to you solely for informational purposes.
© 2011-2017 Ray Energy Corp. All rights reserved. Any reproduction, representation, adaptation, translation, and/or transformation, in whole or in part by whatsoever process, of this site or of one or several of its components, is forbidden without the express written authorization from Ray Energy Corp.