The Gloves Are Coming Off!
An oil war, demand destruction, and how “block the bans” are gaining traction.

A grim combination.
The relentless spread of the coronavirus (COVID-19), which is destroying lives and global energy demand, coupled with an oil price war between two of the largest energy producing countries in the world (Russia and Saudi Arabia), is driving crude oil prices near 20-year lows and natural gas and propane prices near all-time lows.
Russia and Saudi Arabia drop the gloves.
Russia has marched in step with OPEC for three years now. But they are tired of US shale producers benefiting from OPEC and Russian production cuts. So when Russian Energy Minister Alexander Novak said “No” to further cuts at the last OPEC meeting, the Viennese room reportedly became as somber as a funeral parlor. Everyone knew the ramifications. After all, demand from Saudi Arabia’s largest customer (China = 20%) was already in sharp decline, and Saudi Arabia’s economy relies heavily on oil revenue. It shouldn’t have come as a surprise that the Saudi response was to discount prices and raise production.
For Saudi Arabia, the prospect of higher global oil supplies during a period of global oil demand destruction became a “don’t poke the bear” moment. And an example of a low-cost producer protecting market share by lowering prices to force higher-cost producers (including the US Shale industry) to reduce production.
Can energy prices be too low?
Natural gas is the primary “parent” of propane. To be healthy, the natural gas industry needs roughly $2.50 MMBtu. But the average closing price in 2020 has been around $1.70 MMBtu. If the current price environment for natural gas (and crude oil) continues much longer, we’re likely to see producers face increasingly dire levels of financial challenges. We certainly won’t see new drilling from companies that are reducing capital expenditures!
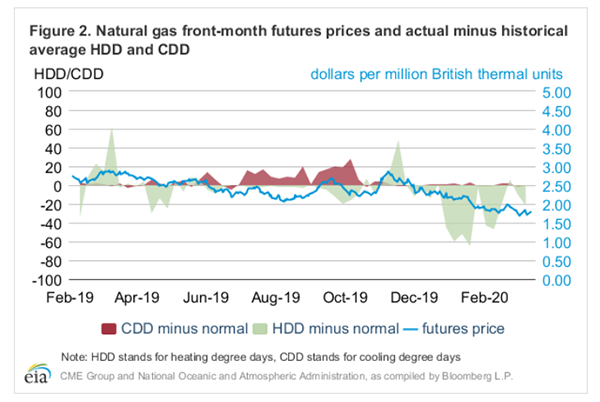
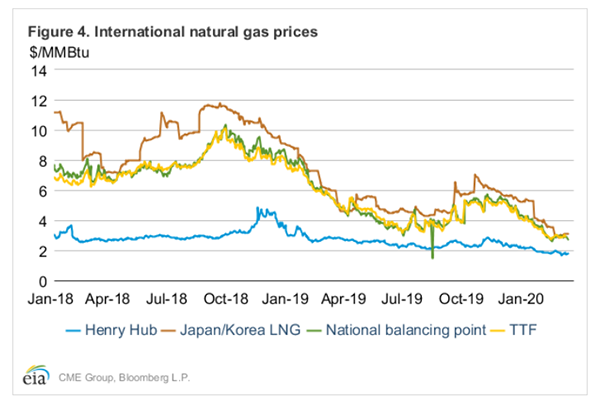
We’re including two natural gas charts below:
- Figure #2 is a domestic price chart that shows a downward price trend against the backdrop of lower demand from heating degree days and cooling degree days.
- Figure #4 shows an international price chart, illustrating the sharp decline in international natural gas prices and a narrowing price spread. The US (Henry Hub) is the bottom line. Title Transfer Facility (TTF) and National Balancing Point (NBP) are European benchmarks.
What does all this mean for me?
Lack of demand, healthy inventory levels, and a narrowing spread between US and international oil and natural gas prices may keep domestic supplies ample and base prices (like Mt. Belvieu, TX) low for a while. Longer-term, a low-price environment that’s unsustainable may lead to production cuts and drops in inventory levels.
Also, current low prices and the expectation of future supply tightness are likely to lead to higher differentials relative to the base price. Since gas processing companies (the folks that make propane) can't increase volume in today's "cash negative" price environment, they will try to stay afloat by cutting costs and capturing margin.
At home, the gloves are coming off in retaliation to forced electrification.
“My house, my choice”!
The “block the bans” movement for freedom of clean-energy choices is gaining traction in the fight against forced electrification.
Lawmakers in the Arizona House (Bill 2686) and Senate (Bill 1222) recently approved bills that would block towns and municipalities from banning gas hookups for new construction. Rather than the “whack-a-mole” approach of challenging every community or municipality that pops up with the intention of restricting consumer choice, the “block the bans” bills were a preemptive strike at the state level to allow consumers freedom of choice regarding clean-energy options.
So there’s a path forward to fight forced electrification: assemble a broad-based coalition that includes the natural gas industry, the national builders associations, and national restaurant associations (among others) to fight these bans at the state and local level. Even the AARP is joining the fight. They recognize that seniors on fixed incomes would see their annual energy costs go up.
Propane Price Chart
EIA Weekly Numbers
Total US propane inventories showed a modest draw of .301 mmbbls. for the week ending March 13, 2020. That brings national inventory levels (excluding non-fuel use propylene) to 61.379 mmbbls., approximately 37 percent ahead of last year and 34 percent ahead of the five-year average.
PADD 2 (Midwest/Conway) inventories showed a minimal draw of .125 mmbbls. They currently stand at 10.495 mmbbls., roughly 22 percent ahead of last year.
PADD 3 (Gulf Coast/Belvieu) inventories showed a small build of .167 mmbbls. They currently stand at 44.527 mmbbls. (excluding non-fuel use propylene), about 42 percent higher than last year.
The Skinny
 Three things:
1. Smile! Your customers should be very happy with where propane prices are now.
2. There have been a lot of industry cancellations lately (like Nashville), but please be assured that we’ll be in touch with you soon regarding your 2020/2021 propane supply contracts with us.
3. Lastly, there’s plenty of stress in the world today. To lighten things up we want to share with you a picture that a New Hampshire customer sent us (Glenn Young brought chocolates to the PGANE spring meeting) of a happy, future Ray Energy customer!
Get Stephen's insights on propane delivered to your inbox every month.
Sign up for our monthly newsletter here.
For more frequent updates and industry news, join us on LinkedIn.
NOTE: The views and opinions expressed herein are solely those of the author, unless attributed to a third-party source, and do not necessarily reflect the views of Ray Energy Corp, its affiliates, or its employees. The information set forth herein has been obtained or derived from sources believed by the author to be reliable. However, the author does not make any representation or warranty, express or implied, as to the information’s accuracy or completeness, nor does the author recommend that the attached information serve as the basis of any buying decision and it has been provided to you solely for informational purposes. © 2011-2020 Ray Energy Corp. All rights reserved. Any reproduction, representation, adaptation, translation, and/or transformation, in whole or in part by whatsoever process, of this site or of one or several of its components, is forbidden without the express written authorization from Ray Energy Corp.